
CASE STUDY
From POC to Production in 20 Days: Full-Stack Observability for a Financial Regulator
Ashnik Team
THE CUSTOMER
A leading financial regulator. It runs digital platforms used by officials, regulated entities, and internal departments across the country.
THE SOLUTION
Ashnik built one Elastic Observability platform for two production applications. It covers metrics, logs, distributed traces (APM), and database-level monitoring across an enterprise knowledge portal and a workflow management system, on a mixed x86 and IBM Z (mainframe) estate. Proof of concept to production took 20 days.
THE CHALLENGE
Both applications ran across four tiers on heterogeneous infrastructure. There was no unified way to trace a slow transaction, monitor concurrent load, or catch a runaway database query before it became an outage. When things went wrong, the impact was immediate and highly visible.
THE RESULT
One observability stack now watches every tier of both applications in production. That includes the IBM Z mainframe tier, where Elastic APM had never been validated. Teams can detect, trace, and resolve issues before they escalate.
20 days
From proof of concept to production
2
Mission-critical applications, one platform
27
Production servers under end-to-end monitoring
1st
Elastic APM validated on IBM Z (s390x)
Customer Overview
The customer operates several digital platforms supporting its regulatory and administrative functions. Two of them matter here. An enterprise knowledge portal, used by officials nationwide for knowledge-sharing, engagement, and internal initiatives. And a workflow management system that handles document handling and process workflows for regulatory operations.
Both run on a similar enterprise stack. Oracle HTTP Server at the web tier, Oracle WebLogic at the application tier, Oracle Database at the persistence layer. The deployment spans standard x86 servers and IBM Z mainframe infrastructure, reflecting the customer’s broader estate. Usage runs across offices nationwide, so both must stay responsive across varied locations and network conditions.
The Challenge
Both applications are mission-critical and highly visible. Officials nationwide use them directly. Observability was a standing mandate, not an improvement project. Failure was not an option. Yet monitoring was fragmented or absent at the layers that mattered. Engineers checked individual hosts by hand when something went wrong.
The gap showed during a nationwide engagement exercise on the knowledge portal. A quiz went out to officials across the country. They logged in together, concurrent load spiked, and the portal became unresponsive nationwide. The incident escalated to senior management. Nobody could say whether the bottleneck was the web tier, the application tier, or the database. Nobody could say how many concurrent sessions were driving it.
This was not a one-off. Both applications had seen performance issues escalate before root cause could be found. The core gaps:
The Approach
Ashnik built one Elastic Observability platform for both applications. Metrics, logs, distributed traces, and database-level insight, deployed consistently across every tier and every architecture.
This is a heavily regulated environment. Every change had to be checked and validated before it touched production. That adds time to work that would otherwise move fast. Trusted with the mandate and backed closely by the customer’s teams, Ashnik went from proof of concept to production in 20 days.
How the 20 days held
Speed came from preparation, not shortcuts. Activities were planned for this exact scenario, backed by pre-built automation, an internal knowledge base, and the ability to anticipate what an engagement like this throws up. Fleet-managed rollout put 27 servers across Linux, Windows, and IBM Z under policy centrally, not host by host. Even the one unproven element, Elastic APM on IBM Z (s390x), was deployed, tested, and in production inside the same window.
Architecture
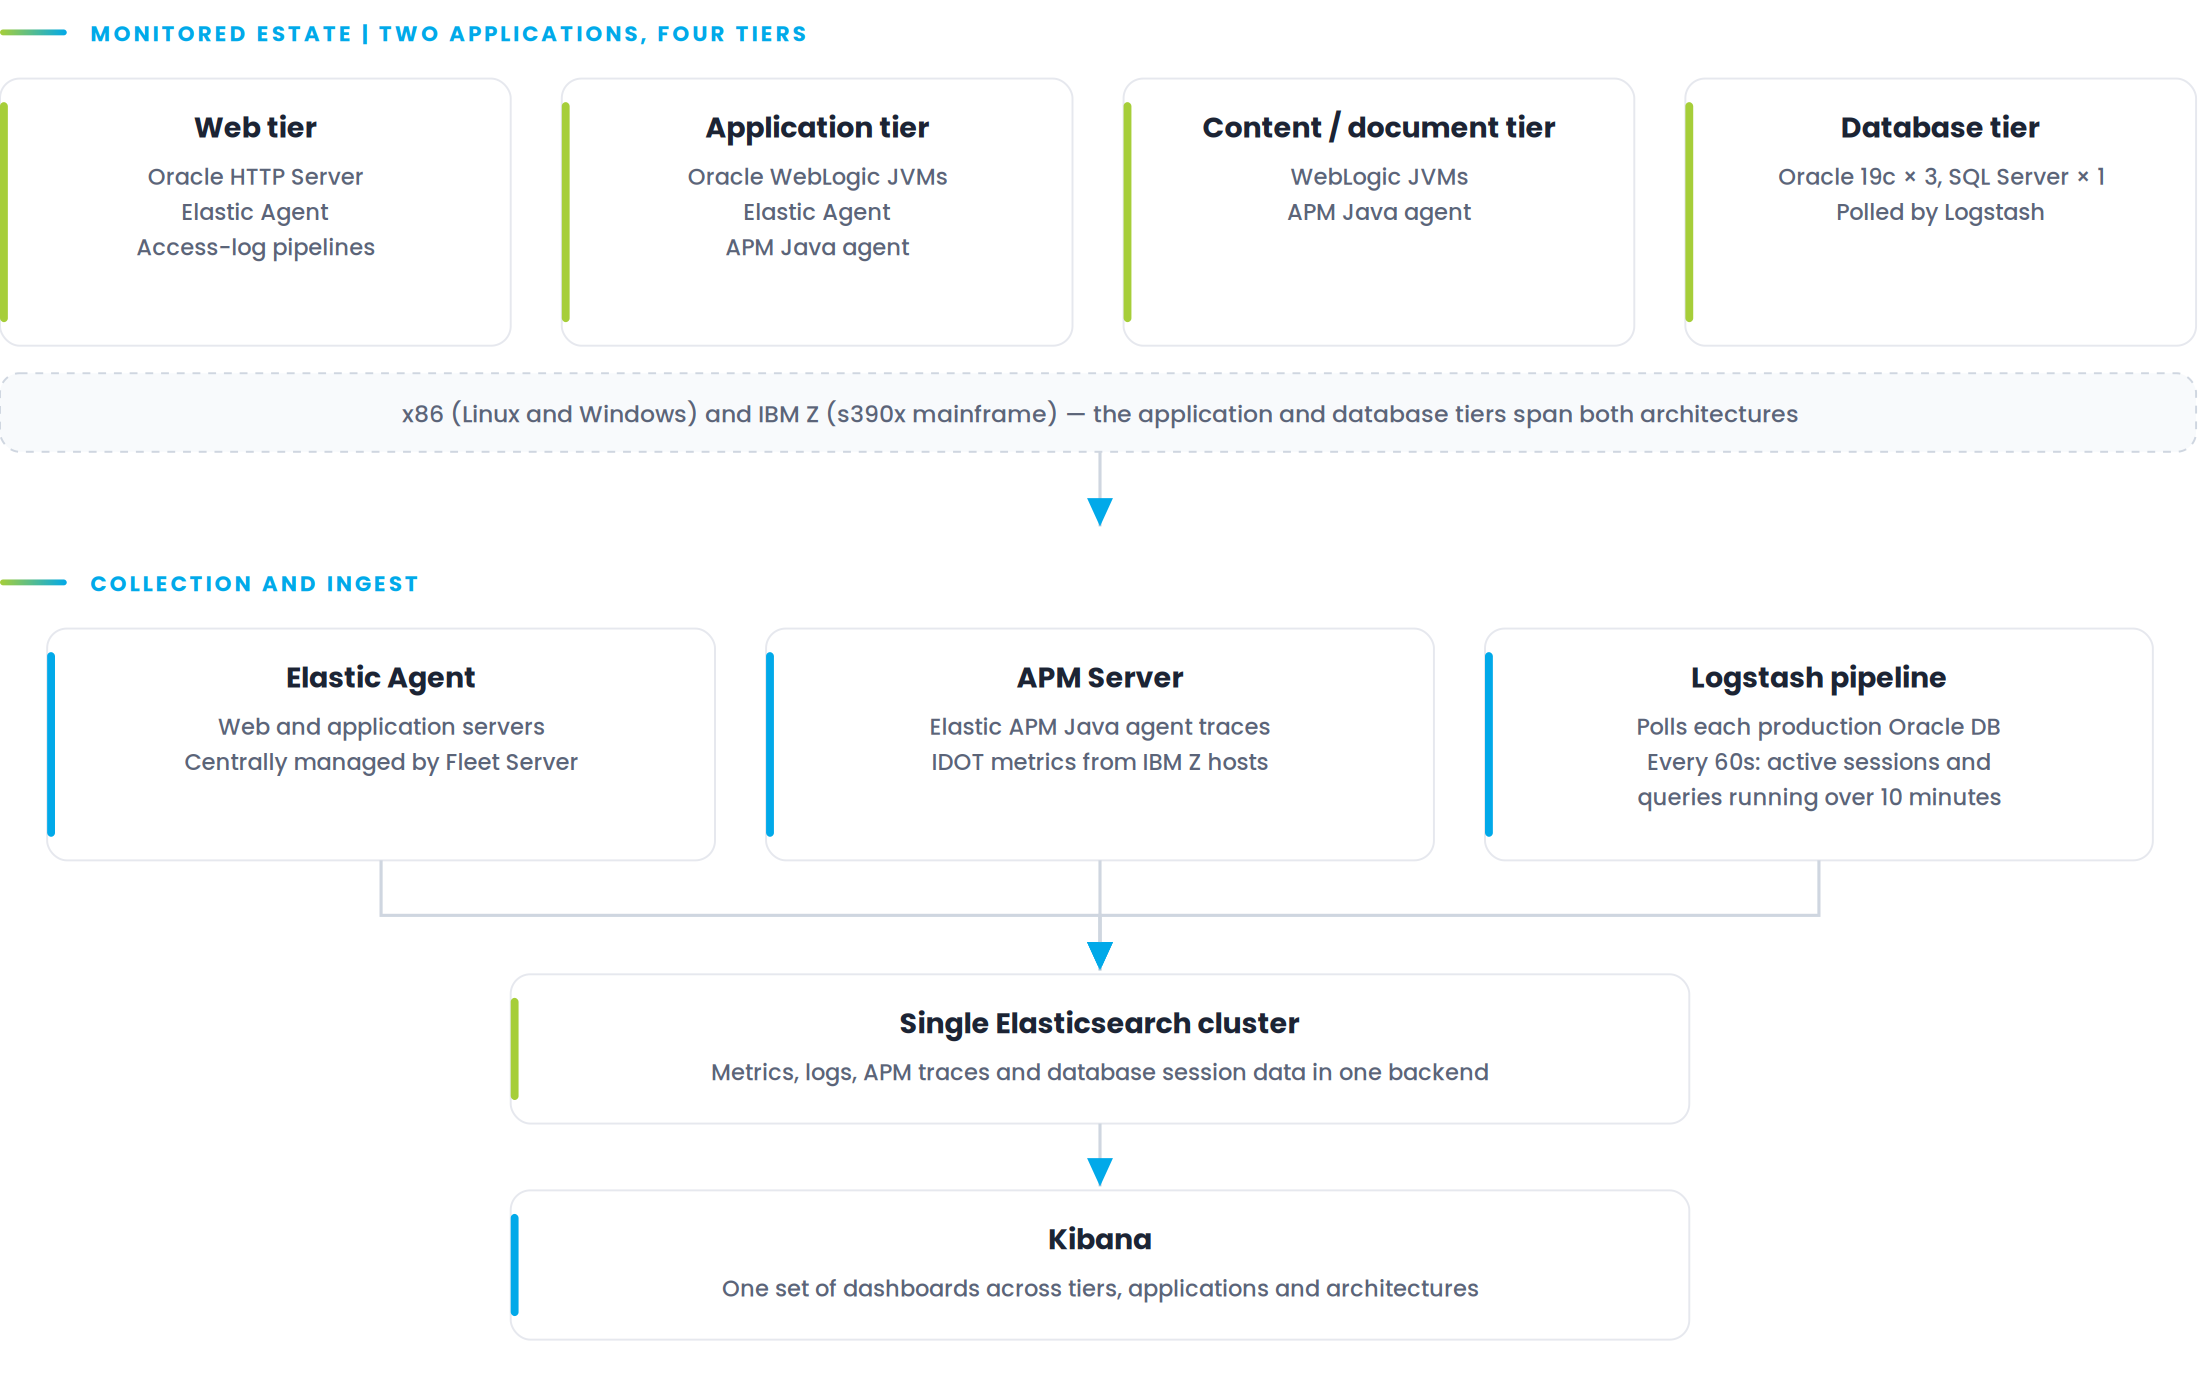
The pattern is consistent across both applications. Fleet-managed Elastic Agents collect metrics and logs at the web and application tiers. The Elastic APM Java agent and IDOT, for the mainframe tier, feed a central APM Server. A Logstash pipeline polls the databases directly. Everything lands in one Elasticsearch cluster, visualized in Kibana.
Scale
| METRIC | VALUE |
|---|---|
| Applications covered | 2 (enterprise knowledge portal and workflow management system) |
| Production servers monitored | 27 |
| Infrastructure architectures spanned | x86 (Linux and Windows) and IBM Z (s390x mainframe) |
| Tiers instrumented per application | 4 (Web, Application, Content, Database) |
| Production database instances monitored | 4 (Oracle 19c × 3, SQL Server × 1) |
| Database health checks | Every 60 seconds, active sessions and long-running queries |
| Observability layers unified | Metrics, Logs, APM Traces, Database Monitoring |