
CASE STUDY
Unified Observability Across Solaris, WebLogic and Oracle for a Leading Small Finance Bank
Ashnik Team
THE CUSTOMER
A leading small finance bank in India with a wide and important banking services footprint. Part of that estate runs on a mature enterprise stack: Oracle Solaris, Oracle WebLogic and SOA workloads, Oracle Database 19c, Oracle HTTP Server and a set of related application components.
THE SOLUTION
A hybrid, low-impact collection pattern. Elastic Java APM on WebLogic, JMX/Jolokia for middleware runtime metrics, Solaris-native telemetry through kstat, normalised log forwarding with multiline logic, and Oracle monitoring through controlled read-only SQL access, all correlated in Elastic.
THE CHALLENGE
The standard Elastic Agent and commonly used Beats collectors weren’t available as a supported pattern on Solaris. The bank needed application-to-database observability without adding unsupported software or introducing operational risk.
THE RESULT
A proof of concept that delivered one common observability layer spanning the Java application, WebLogic middleware, Solaris operating system and Oracle database, plus a repeatable architecture and an evidence-based blueprint for a phased enterprise rollout.
4
Observability domains covered: logs, metrics, APM and database telemetry
~200
Applications assessed across the enterprise landscape (approximate)
~50
Tier-one applications considered for the initial phase (approximate)
~20 TB/day
Projected enterprise ingestion, a sizing estimate
Customer Overview
The customer is a leading small finance bank in India with a wide and important banking services footprint. Part of that estate runs on a mature enterprise stack: Oracle Solaris, Oracle WebLogic and SOA workloads, Oracle Database 19c, Oracle HTTP Server and a set of related application components.
The bank wasn’t just looking to install a monitoring tool. It wanted to know whether Elastic Observability could give it one common operational view across applications, middleware, operating systems and databases, including technology that didn’t have a native Elastic collection agent to begin with.
The Challenge: Observability Without a Native Agent
A leading small finance bank in India wanted one operational view across a business-critical stack built on Oracle Solaris, Oracle WebLogic and Oracle Database. The catch: the standard Elastic Agent and Beats collectors, the usual starting point for Elastic Observability, weren’t available as a supported pattern on Solaris. Ashnik was brought in to work out whether unified observability was even possible here, and if so, how to get there without disturbing a mature, business-critical estate.
What followed was a proof of concept and a broader enterprise assessment that gave the bank a working answer, and a blueprint for scaling it up. Four things stood in the way of a straightforward rollout:
Ashnik’s Approach: A Hybrid, Low-Impact Pattern
The underlying design question was simple to state and harder to answer: how do you get application-to-database observability across a specialised Solaris and Oracle stack, without adding unsupported software or introducing operational risk?
Rather than trying to force a standard collection model onto the Solaris estate, Ashnik designed a hybrid approach that met the platform where it was:
A Publication-Safe View of the Architecture
The architecture below has been simplified for external sharing. It preserves the design logic while leaving out internal identities, addresses, credentials and other security-sensitive implementation detail.
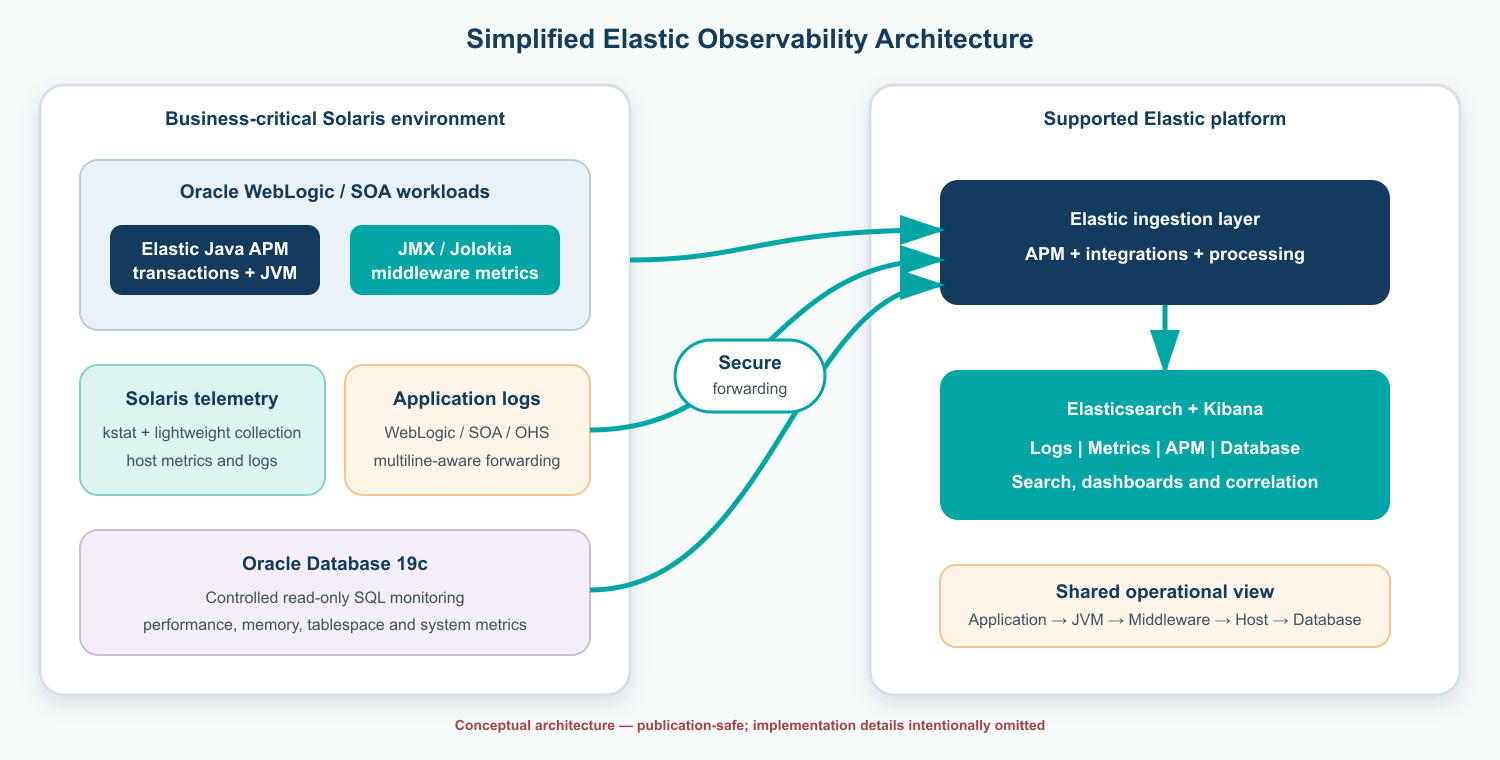
At a glance, the architecture works like this:
- Elastic Java APM captures application transactions and JVM behaviour from the WebLogic environment.
- JMX/Jolokia adds a complementary path for middleware-specific runtime metrics.
- Solaris-native mechanisms collect host metrics and logs with a lightweight footprint.
- Oracle Database metrics are collected through controlled, read-only SQL access.
- Secure forwarding carries telemetry to the supported Elastic ingestion layer.
- Elasticsearch and Kibana provide the central search, dashboards and cross-layer correlation.
Assessment Scope and Sizing
Alongside the PoC, Ashnik ran a broader observability assessment to understand what a full enterprise rollout would look like. These are planning inputs and projected figures from that sizing exercise, not achieved production throughput or a completed rollout.
| AREA | FIGURE |
|---|---|
| Enterprise application landscape | approximately 200 applications assessed |
| Initial enterprise phase | approximately 50 tier-one applications considered |
| Projected enterprise ingestion | approximately 20 TB/day — a sizing estimate, not achieved throughput |
| Elastic resource sizing | approximately 50 ERUs — an assessment estimate |
| Platform validated in the PoC | Oracle Solaris 11.4, Oracle WebLogic/SOA and Oracle Database 19c |
| Host telemetry validated | CPU, load, memory, filesystem, swap and ZFS ARC |
| PoC collection interval | approximately one minute for host metrics |
| Observability domains covered | logs, metrics, APM and database telemetry |
| Enterprise planning areas | ingestion, retention, dashboards, correlation and resource sizing |
What the PoC Demonstrated
Business Impact
In a banking environment, observability creates value by shortening the path from “there is an issue” to “this is where the issue originated.” This engagement laid the foundation for a connected troubleshooting journey across transaction, JVM, middleware, host and database. In practice, that means:
- A shared telemetry foundation for application, middleware, infrastructure and database teams.
- Less dependence on isolated tools and disconnected troubleshooting workflows.
- Faster fault isolation, by connecting service symptoms to the underlying technology layer causing them.
- Protected investment in the established Solaris and Oracle estate, while still introducing modern observability.
- An evidence-based blueprint for a phased enterprise rollout and sizing exercise.