



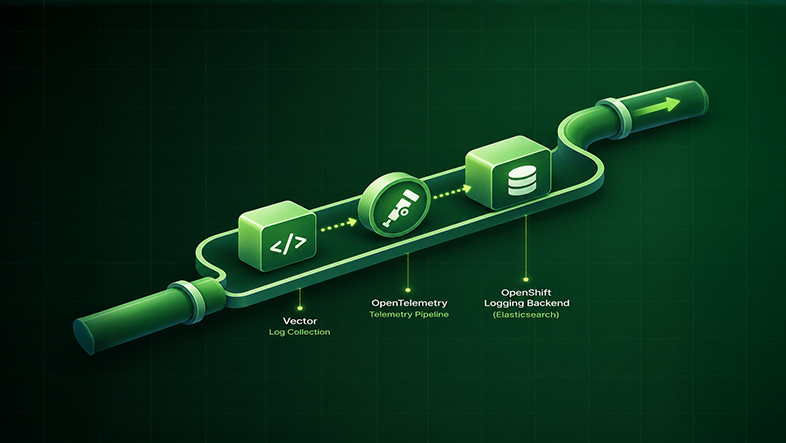

Observability is only as good as the data it captures.
In one of OpenShift implementations, we deployed a centralized logging solution using the OpenShift Cluster Log Forwarder (CLF) with Vector. The goal was straightforward: collect application logs from the cluster and forward them to Elasticsearch for analysis in Kibana.
Standard application logs worked as expected, collected, indexed, and available in Kibana without issue. During testing, though, we found a problem with a specific class of log: multiline Java exception stack traces.
Java stack traces span multiple lines by design; a single exception can run to dozens of lines of trace output. In Elasticsearch, these were no longer arriving as one log event. A single exception was being split across multiple documents.
This matters more in a BFSI environment than it might elsewhere. A stack trace scattered across documents becomes unreadable. Root cause analysis slows down. And if that same fragmented trail is ever pulled up during an incident review or audit, “mostly complete” is a weaker position than “complete.” We caught this during testing, not in production, but the gap was real and needed fixing before go-live.
We traced the root cause to Vector’s harvester, which reads log files in fixed-size chunks capped at 16 KB. Any multiline event larger than that chunk size was being split before it reached Elasticsearch at all.
Our first move was the obvious one: Vector supports multiline handling natively, so we configured a multiline pattern to reassemble the stack traces before they shipped.
It didn’t resolve the issue, and the reason is worth explaining because it shaped the decision that followed. The problem wasn’t the pattern we’d written. It was that the pattern never had a chance to run correctly. Vector’s harvester reads in fixed 16 KB chunks, and any multiline event larger than that gets split before it reaches the multiline transform stage. By the time our pattern was evaluating a given line, the event had already been cut mid-trace, one layer upstream of the setting we were trying to use to fix it.
That distinction is the core of this migration. No amount of tuning a downstream multiline pattern can repair a split that already happened upstream of it, at the file-read layer. The fix needed to change how logs were being read, not how they were grouped after the fact.
Faced with a fix that didn’t work, we didn’t move straight to swapping tools. We followed a deliberate sequence:
This sequence, reproduce, attempt the native fix, isolate the real failure point, fix at that layer, and verify against the original condition, is the same approach we apply across observability engagements, regardless of the specific tools involved.
Rather than work around Vector’s chunking limitation, we replaced the Cluster Log Forwarder and Vector with the OpenTelemetry Collector for application log collection.
The OpenTelemetry Collector’s recombine operator addresses the problem at the layer where Vector was failing. It identifies the start of a new log event as each line is read, with no fixed chunk-size ceiling forcing a cut partway through an event. This also gave us a foundation for collecting metrics through the same pipeline going forward, not just a fix for the immediate multiline issue.
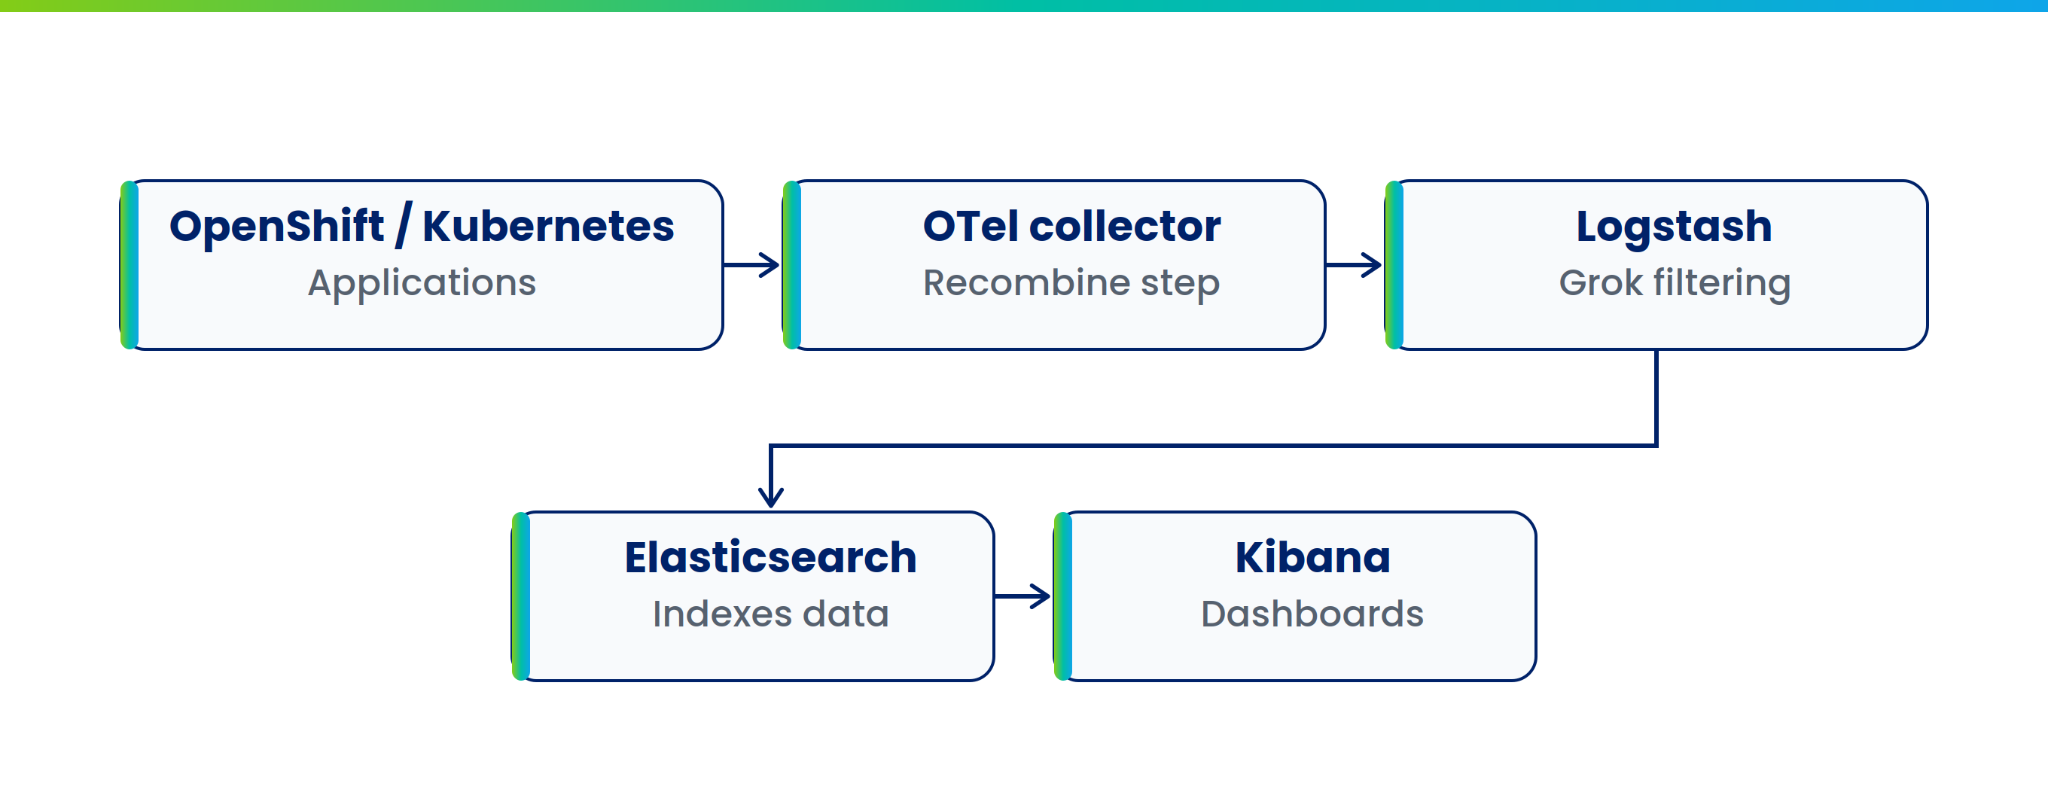
Within the Collector, we configured a filelog receiver to read container log files directly from OpenShift nodes, with a container parser operator unwrapping Kubernetes’ log envelope before the rest of the pipeline touched the message body.
A recombine operator then reconstructs multiline events. Instead of treating every line as its own record, it identifies the start of a new log event using application-specific patterns. In our configuration, a line is treated as the beginning of a new entry if it matches an EVENT_DATE_TIME= marker, an EVENT_TIME= marker, or a leading YYYY-MM-DD timestamp. Anything that doesn’t match, stack frames, continuation lines, wrapped JSON, is appended to the entry already being built, up to a configured maximum of 1,048,576 bytes (1 MB) per combined record, well above what Vector’s chunking allowed.
operators:

  - type: container

    id: container-parser

  - type: recombine

    id: java-multiline

    combine_field: body

    is_first_entry: >

      body matches "EVENT_DATE_TIME=" or

      body matches "^\\d{4}-\\d{2}-\\d{2}" or

      body matches "EVENT_TIME="

    source_identifier: attributes["log.file.path"]

    combine_with: "\n"

    max_batch_size: 250

    max_log_size: 1048576
Three add operators attach Kubernetes metadata, namespace, pod name, and container name, to every log record as resource fields, pulled directly from attributes the Collector already has:
 - type: add

    field: resource["k8s.namespace.name"]

    value: EXPR(attributes["k8s.namespace.name"])

  - type: add

    field: resource["k8s.pod.name"]

    value: EXPR(attributes["k8s.pod.name"])

  - type: add

    field: resource["k8s.container.name"]

    value: EXPR(attributes["k8s.container.name"])
That metadata is what makes the logs usable in Kibana afterward, engineers can filter and search by namespace, pod, or container without an additional lookup step.
One design decision worth explaining: why route through Logstash at all, instead of sending the Collector’s output straight to Elasticsearch?
Logstash was already handling parsing and enrichment in this environment, specifically Grok-based field extraction and filtering. Rebuilding that logic inside the Collector, or re-implementing it as Elasticsearch ingest pipelines, would have meant redoing work that already worked. We kept Logstash as the parsing and filtering layer and pointed the Collector at it, so existing Grok patterns kept working unchanged while we fixed the multiline problem at the layer where it actually originated.
After the migration, we tested a large multiline Java stack trace against Kibana. It arrived as a single, complete document, the outcome the original pipeline had not been able to deliver.

This was caught and resolved during testing, before it reached a live troubleshooting scenario. For a BFSI environment, that is the outcome worth having, catching a data-integrity gap before it costs anyone time during an actual incident.
Engineering decisions are rarely about replacing one technology with another because it’s newer. Here, the first step was to try fixing the problem within the existing tool, reconfiguring Vector’s multiline handling. It was only once we traced the issue to a layer below that setting- how the harvester reads log files in the first place- that switching collectors became the correct decision rather than the convenient one.
Any OpenShift environment running Java workloads, particularly across BFSI infrastructure where multiline stack traces are routine, is a plausible candidate for the same fragmentation, whether or not anyone has noticed it yet.
Sometimes the biggest improvement isn’t collecting more data. It’s making sure every log reaches your observability platform exactly as the application generated it.

