



Modern enterprises rarely run on one platform. While observability is straightforward for mainstream operating systems, monitoring IBM AIX workloads presents unique challenges due to limited native agent support.
The goal for this implementation was straightforward on paper: a single, centralized observability platform on Elasticsearch and Kibana, covering every application in the environment. On the Linux side, that came together fast: Fleet-managed Elastic Agent enrolled cleanly, and infrastructure metrics, Apache logs, and Tomcat logs were flowing within hours. Then we got to the IBM AIX servers, and the plan hit a wall.
The AIX systems in scope weren’t incidental. They were running IBM WebSphere Application Server, IBM MQ, and IBM DB2, three of the most business-critical pieces of the whole environment. When we tried to bring them into the same monitoring pipeline as everything else, we hit a hard limitation: Elastic Agent is not supported on IBM AIX.
That left a real gap. Without an alternative way to collect logs and metrics, WebSphere, MQ, and DB2, exactly the systems where a BFSI environment is most likely to have a problem worth catching early, would sit outside the observability platform entirely, invisible next to everything else already brought online.
This wasn’t tracked as a formal risk assessment with a specific downtime figure attached. The urgency was understood qualitatively: WebSphere, MQ, and DB2 sit in the business-critical tier, so a monitoring gap there mattered more than an equivalent gap on the Linux side would have. That was enough to make closing it a priority before go-live, not a nice-to-have for later.
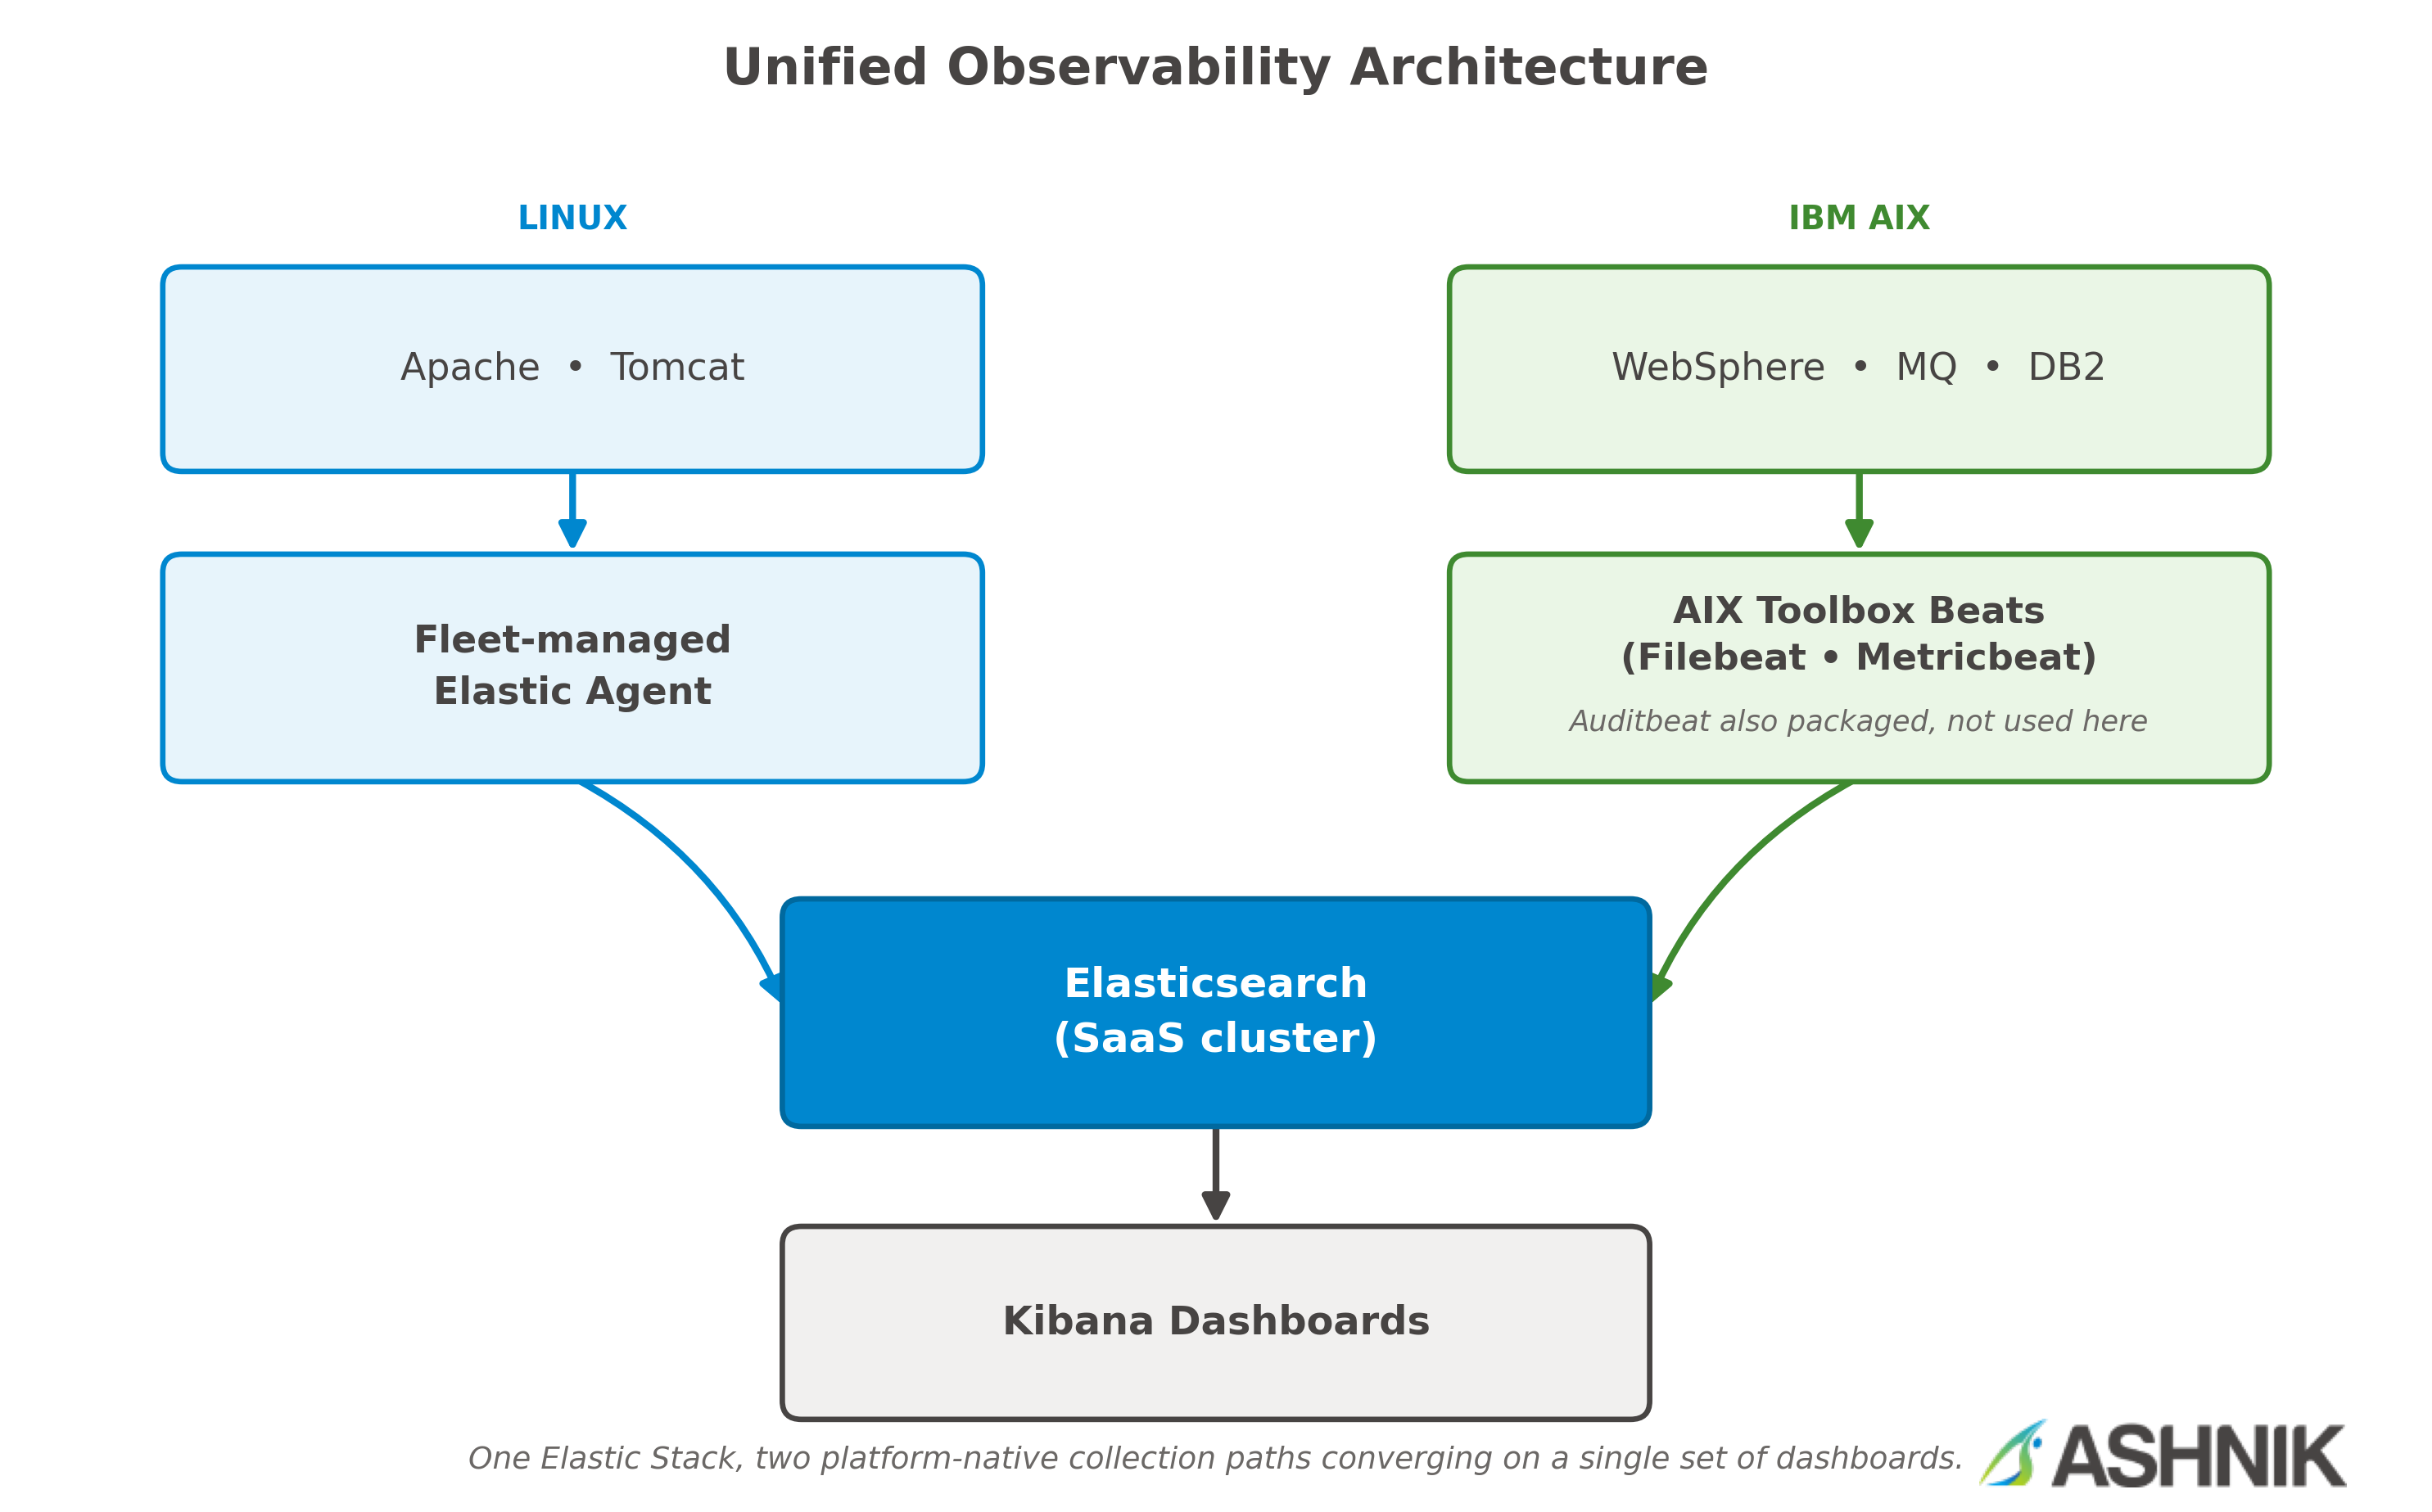
For AIX, we carried forward the same principle that shaped the whole rollout: use the tooling built for the platform it runs on. On Linux, that’s Fleet-managed Elastic Agent. On IBM AIX, that meant going straight to IBM’s own AIX Toolbox for Open Source Software, IBM’s package repository for AIX, which includes Filebeat, Metricbeat, and Auditbeat builds (version 8.17.1) purpose-built for the platform.
This let us bring AIX into the same Elastic Stack the Linux tier was already running on: standalone Beats, configured directly, shipping straight to the same Elasticsearch SaaS cluster. Two platforms, one observability platform, each running the agent best suited to it.
With the AIX Toolbox Beats identified, the rollout came together piece by piece:
All the while, the Linux environment kept reporting through the Fleet-managed Elastic Agent, including infrastructure metrics, Apache logs, and Tomcat logs, so the two platforms were converging into one picture rather than running as two separate monitoring efforts.
Of all the AIX-side work, WebSphere’s logs needed the most deliberate handling. The core issue was that WebSphere’s SystemOut.log, SystemErr.log, and native_stderr.log don’t write one log entry per line, a single event, whether an exception, a stack trace, or a native error dump, spans multiple lines.
WebSphere’s default log format starts each entry with a timestamp, for example:
[8/17/26 10:15:22:123 IST] 0000004a SystemOut Ofollowed by the message. A normal log line matches that pattern once and stays a single event. A stack trace doesn’t: the exception’s header line matches the timestamp pattern, but every subsequent “at com.example…” frame underneath it does not, so without multiline handling each of those frames gets read as if it were its own timestamp-less log entry.
Left unhandled, Filebeat would treat every line as its own event, shredding each WebSphere exception into multiple disconnected documents in Elasticsearch, the same fragmentation problem multiline Java logs create in any pipeline that isn’t configured to expect them. We fixed this with a multiline pattern keyed off WebSphere’s own timestamp format; a line only starts a new log entry if it matches that pattern; everything else is treated as a continuation of the event already being built.
None of this went in without friction, and most of the real work was infrastructure coordination rather than software configuration:
Each of these was worked through in close coordination with the infrastructure and application teams, without needing to change the overall architecture the rollout was designed around.
By pairing Fleet-managed Elastic Agent on Linux with Beats from the AIX Toolbox on AIX, the implementation delivered exactly what it set out to: centralized monitoring across two very different platforms, in one place.
The approach itself is repeatable. Beats from the AIX Toolbox for Open Source Software are the standard choice for AIX hosts, running alongside Fleet-managed Elastic Agent everywhere else, and the air-gapped rollout process, approvals, offline transfer, is common across BFSI environments generally, not unique to this one.
What isn’t directly portable as-is is the exact configuration. The WebSphere and MQ multiline patterns here were built against this customer’s specific log format and WebSphere version, so they would need to be re-verified against each new environment’s setup before reuse, not copied over wholesale.
The absence of a supported agent on AIX wasn’t treated as a dead end to work around quietly, it was treated as a gap in a business-critical tier of the environment, worth solving properly before the platform could be called complete. Going straight to IBM’s own AIX Toolbox for Open Source Software meant the fix was built using tooling designed for AIX itself, keeping the whole environment on one Elastic Stack rather than introducing a second monitoring system just for AIX.
Any BFSI environment running WebSphere, MQ, or DB2 on IBM AIX is a plausible candidate for this same blind spot, worth checking for even where no one has flagged it yet.