
What is Grafana?
Grafana is a multi-platform open source analytical and visualization tool consisting of multiple individual panels arranged in a grid. The panels interact with configured data sources like AWS CloudWatch, Microsoft SQL server, Prometheus, MySQL, InfluxDB, and many others. The design of Grafana is such that each panel is tied to a data source. The Grafana dashboards which contains multiple panels in a single grid, helps to visualize results from multiple data sources simultaneously.
What is Prometheus?
Prometheus is an open-source tool that enables you to monitor databases, VMs, and basically anything else. With its cloud-native monitoring capabilities, there’s a time-series database that sweeps data from a bunch of exporters that you define. In order to export all of the resource-monitoring metrics that you need to properly monitor your database servers the most popular exporter is node-exporter for Prometheus at system-level resource monitoring,
The Prometheus Alertmanager, helps to generate alerts for metric thresholds. What’s more, you can use Grafana to set up dashboards with Prometheus, observe the patterns and behaviors of the metrics you have collected. For PostgreSQL, you can also use a PostgreSQL exporter to export vital metrics such as active sessions, database locks, and replication.
Benefits of Grafana and Prometheus
- They are Open Source based
- Customizable and allows to create your own monitoring dashboard
- With Time picker dropdown access relative time range options, auto refresh options and set custom absolute time ranges
- Graph legend provides legend information from the graph
- Automatic service discovery facility is available
- Widely available community support
- Supports both system and database performance metrics
- Flexibility to configure custom metrics that are not supported by default in PostgreSQL exporter
How to Configure Grafana for PostgreSQL Monitoring?
Today, let’s deep dive into the type of monitoring that we need to choose for PostgreSQL database server and the various monitoring tools. Grafana ships with a built-in PostgreSQL data source plugin that allows you to query and visualize the data from a PostgreSQL compatible database. The PostgreSQL integration for Grafana’s prebuilt dashboard allows you to visualize important performance heuristics in real time such as System Resource Monitoring (CPU, Memory, Storage, Network), Database Monitoring (Active session, Replication Status, Query Performance, etc).
Now, let’s configure Grafana for PostgreSQL Monitoring by following the key steps mentioned below:
- Download and Install Grafana
First we need to create Grafana repositories to download the grafana-server package.# vi /etc/yum.repos.d/grafana.repo
[grafana]
name=grafana
baseurl=https://packages.grafana.com/oss/rpm
repo_gpgcheck=1
enabled=1
gpgcheck=1
gpgkey=https://packages.grafana.com/gpg.key
sslverify=1
sslcacert=/etc/pki/tls/certs/ca-bundle.crtInstall and start Grafana service by using systemctl command.
# yum install grafana -y
# systemctl enable grafana-server
# systemctl start grafana-serverPost that we need to verify whether the Grafana application can be accessed, using the below mentioned url or not.
https://
:3000/ - Next step is to Download and install Prometheus
Download the Prometheus binary by using this command.# wget https://github.com/prometheus/prometheus/releases/download/v2.29.1/prometheus-2.29.1.linux-amd64.tar.gz
Extract the Prometheus installation source.
# tar -xzf prometheus-2.29.1.linux-amd64.tar.gz -C /tmp/prometheus-filesRename the Prometheus binary file to the user binary folder in the server.
# mv prometheus-2.29.1.linux-amd64 prometheus-files
# cp /root/prometheus-files/prometheus /usr/bin/
# cp /root/prometheus-files/promtool /usr/bin/Finally Verify the Prometheus version
# prometheus -V
- Configure Prometheus to get linux matrix such as CPU, Memory, etc.
The Prometheus needs to be configured for use. For this we need to create a user and directory first and then set the ownership to Prometheus.# sudo useradd –no-create-home –shell /bin/false prometheus
# sudo mkdir /etc/prometheus
# sudo mkdir /var/lib/prometheus
# sudo chown prometheus:prometheus /etc/prometheus
# sudo chown prometheus:prometheus /var/lib/prometheusCopy all the Prometheus files to the user binary directory and give permissions using this command below:
# sudo cp prometheus-files/prometheus /usr/local/bin/
# sudo cp prometheus-files/promtool /usr/local/bin/
# sudo chown prometheus:prometheus /usr/local/bin/prometheus
# sudo chown prometheus:prometheus /usr/local/bin/promtool
# sudo cp -r prometheus-files/consoles /etc/prometheus
# sudo cp -r prometheus-files/console_libraries /etc/prometheus
# sudo chown -R prometheus:prometheus /etc/prometheus/consoles
# sudo chown -R prometheus:prometheus /etc/prometheus/console_librariesCreate the Prometheus yml file
# vi /etc/prometheus/prometheus.yml
global:
scrape_interval: 10sscrape_configs:
– job_name: ‘prometheus’
scrape_interval: 5s
static_configs:
– targets: [‘10.0.0.153:9090’]Change the ownership of yml file to Prometheus.
# chown prometheus.prometheus /etc/prometheus/prometheus.yml
Create and start the Prometheus service.
# vi /etc/systemd/system/prometheus.service
[Unit]
Description=Prometheus
Wants=network-online.target
After=network-online.target[Service]
User=prometheus
Group=prometheus
Type=simple
ExecStart=/usr/local/bin/prometheus \
–config.file /etc/prometheus/prometheus.yml \
–storage.tsdb.path /var/lib/prometheus/ \
–web.console.templates=/etc/prometheus/consoles \
–web.console.libraries=/etc/prometheus/console_libraries[Install]
WantedBy=multi-user.target# sudo systemctl daemon-reload
# sudo systemctl enable prometheus
# sudo systemctl start prometheusVerify Prometheus Web UI
https://
:9090/graph - Download and configure the Postgres_exporter
Create a directory for Postgres_exporter and download the binary of Postgres_exporter# mkdir /opt/postgres_exporter
# cd /opt/postgres_exporter
# wget https://github.com/wrouesnel/postgres_exporter/releases/download/v0.5.1/postgres_exporter_v0.5.1_linux-amd64.tar.gzExtract the Postgres_exporter file and copy to the user binary directory.
# tar -xzvf postgres_exporter_v0.5.1_linux-amd64.tar.gz
# cd postgres_exporter_v0.5.1_linux-amd64
# cp postgres_exporter /usr/local/bin
# cd /opt/postgres_exporterCreating the Postgres_exporter env file using vi text editor.
# sudo vi postgres_exporter.env
DATA_SOURCE_NAME=”postgresql://: @ : /?sslmode=disable” Below mentioned is the script to create Postgres_exporter service file using vi text editor.
# vi /etc/systemd/system/postgres_exporter.service
[Unit]
Description=Prometheus exporter for Postgresql
Wants=network-online.target
After=network-online.target
[Service]
User=postgres
Group=postgres
WorkingDirectory=/opt/postgres_exporter
EnvironmentFile=/opt/postgres_exporter/postgres_exporter.env
ExecStart=/usr/local/bin/postgres_exporter
Restart=always
[Install]
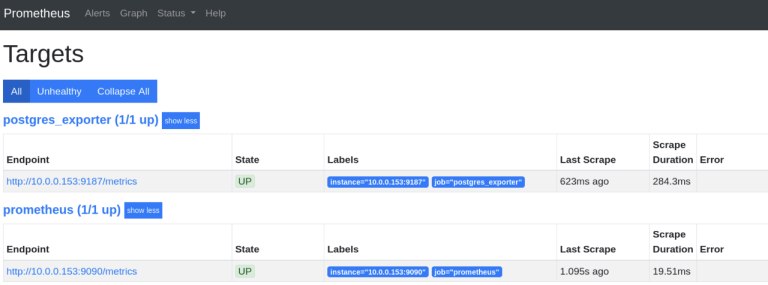
WantedBy=multi-user.targetStart the Postgres_exporter service and ensure the target service has been set to “UP” at the Prometheus web UI.
# sudo systemctl daemon-reload
# sudo systemctl start postgres_exporter
# sudo systemctl enable postgres_exporter
Screenshot of Prometheus web GUI.
- Importing Grafana Dashboard for PostgreSQL Monitoring
To import the Grafana dashboard, Prometheus acts to collect the statistical data matrix ( which is in binary format) from the Operating system and Postgres_exporter acts to collect the database data matrix from PostgreSQL to be monitored in Grafana.
Grafana login page
At this point we have installed and configured Grafana, PostgreSQL & Prometheus have been added as data sources and the Postgres_exporter matrix collector has also been configured. We can now generate new graphs by creating manual queries under the new dashboards feature or else you can use any of the pre-built Grafana dashboard templates for monitoring PostgreSQL.
Let’s take a look at the steps below to achieve the aforementioned objective:
- First, we need to set up our Grafana dashboard by visiting the Grafana PostgreSQL Dashboard and choosing the suitable dashboard for PostgreSQL monitoring (in this case for System Resource Monitoring and Database Monitoring).
Grafana PostgreSQL Dashboards
- The next step is to download the Grafana dashboard JSON or copy the ID number of the dashboard to import it into our Grafana dashboard.
Screenshot of Detailed PostgreSQL Dashboard
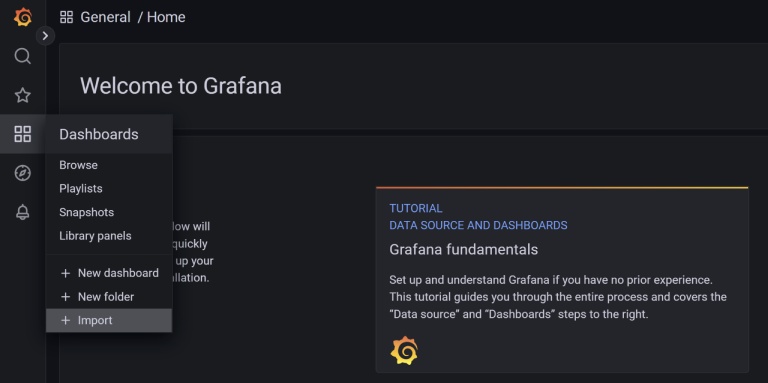
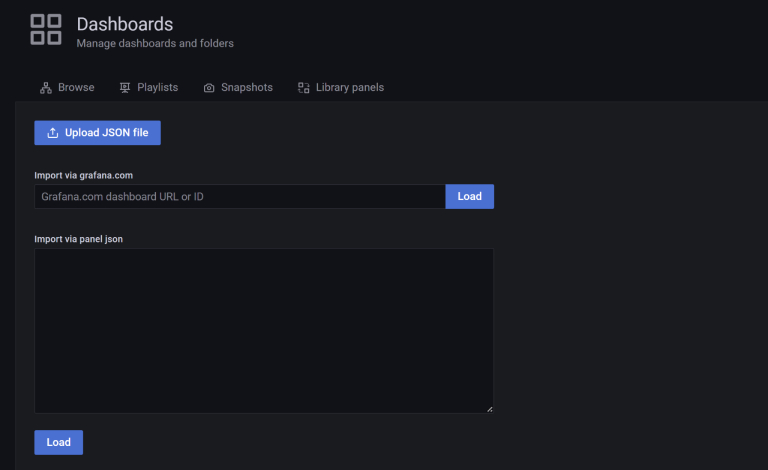
- In order to import either the JSON file or the Dashboard ID to our Grafana dashboard we need to follow the below-mentioned steps:
- Go to the left menu bar
- Click the dashboard icon to import the dashboard ID or upload the Dashboard JSON file that we have downloaded from the Grafana PostgreSQL Dashboard.
Screenshot of Grafana Homepage
Screenshot of Grafana Dashboard Import Menu
- After executing step number 3 above you will be able to see the dashboard list ( reference image below). Now, you will be able to access the dashboard by clicking Grafana Dashboard and then clicking browse to see the dashboard management menu.
Screenshot of Grafana Dashboard Management
- After choosing the dashboard to be monitored in the dashboard management, now we are able to see the dashboard to monitor our PostgreSQL database server that contains system resources and database monitoring.( what ate these types of??)
System Resource Monitoring
Database Monitoring
- First, we need to set up our Grafana dashboard by visiting the Grafana PostgreSQL Dashboard and choosing the suitable dashboard for PostgreSQL monitoring (in this case for System Resource Monitoring and Database Monitoring).
How can Ashnik help you?
We at Ashnik can help you by offering consulting services, technical services, migration services, managed services, and training programs in several open-source technologies and share with you our experience of helping several enterprises across SEA and India. We can help you put together database platforms, and high-speed data pipelines and re-architect your applications using DevOps automation, Kubernetes, and microservices architecture, and facilitate multi-cloud or hybrid adoption.
It is very important for the database monitoring system to be resilient, scalable, and flexible, while still supporting collaboration. Ashnik works with several leading enterprise open-source technology partners like Grafana that provide reliable dashboards for monitoring.
Ashnik also provides you with the ability to monitor your PostgreSQL database, with a meaningful dashboard in real-time. We are ready to help you make timely actions through our expertise in open source services, support, and solutions.
Get in touch today for a free consultation with our team of experts!
Found this article useful? You may like to check out how Ashnik helped with simplifying data migration and automation for a multinational mobile advertising company.


