
When I work on large banking and payment systems, one thing becomes very clear. Data is never the problem. Understanding that data on time is.
Every transaction creates logs. Every system component generates metrics. When systems run 24/7, this data keeps coming without pause. The real challenge is not collecting logs, but figuring out what is going wrong quickly enough to take action.
This is the situation I faced while working on observability for high-volume banking systems.
Where monitoring started to struggle
The systems I worked on process transactions continuously. Log ingestion alone was around 300–400 GB per day, coming from core banking applications, transaction systems, and infrastructure.
From the outside, things looked fine. Logs were centralized. Dashboards were available. Search worked properly.
But on the operations side, problems were visible:
- Manual monitoring took a lot of time
- Simple alerts worked only for basic issues
- Patterns across time were hard to catch quickly
- Some critical issues were detected late
Over time, I realized that the main risk was not system failure itself, but delay in detection.
Why banking systems are different
Banking systems do not fail in a clean way.
Sometimes a short spike in transaction declines is more serious than a complete outage. Sometimes missing logs are a sign of failure, not just logging issues. Very often, what matters is how today compares with yesterday, not just a fixed threshold.
To detect such issues, I had to compare behavior across multiple days. In many cases, this meant scanning more than 1 TB of data for comparison-based checks.
At this point, traditional alerting methods start becoming difficult to manage.
Deciding what really needed to be solved
Before changing anything, I was clear about the goals:
- Detect issues within minutes
- Reduce manual dashboard checking
- Catch issues that appear only when comparing data across days
- Avoid too many duplicate alerts
- Integrate alerts with incident tracking systems
The focus was not on adding more alerts, but on making alerts useful.
How the setup looks in practice
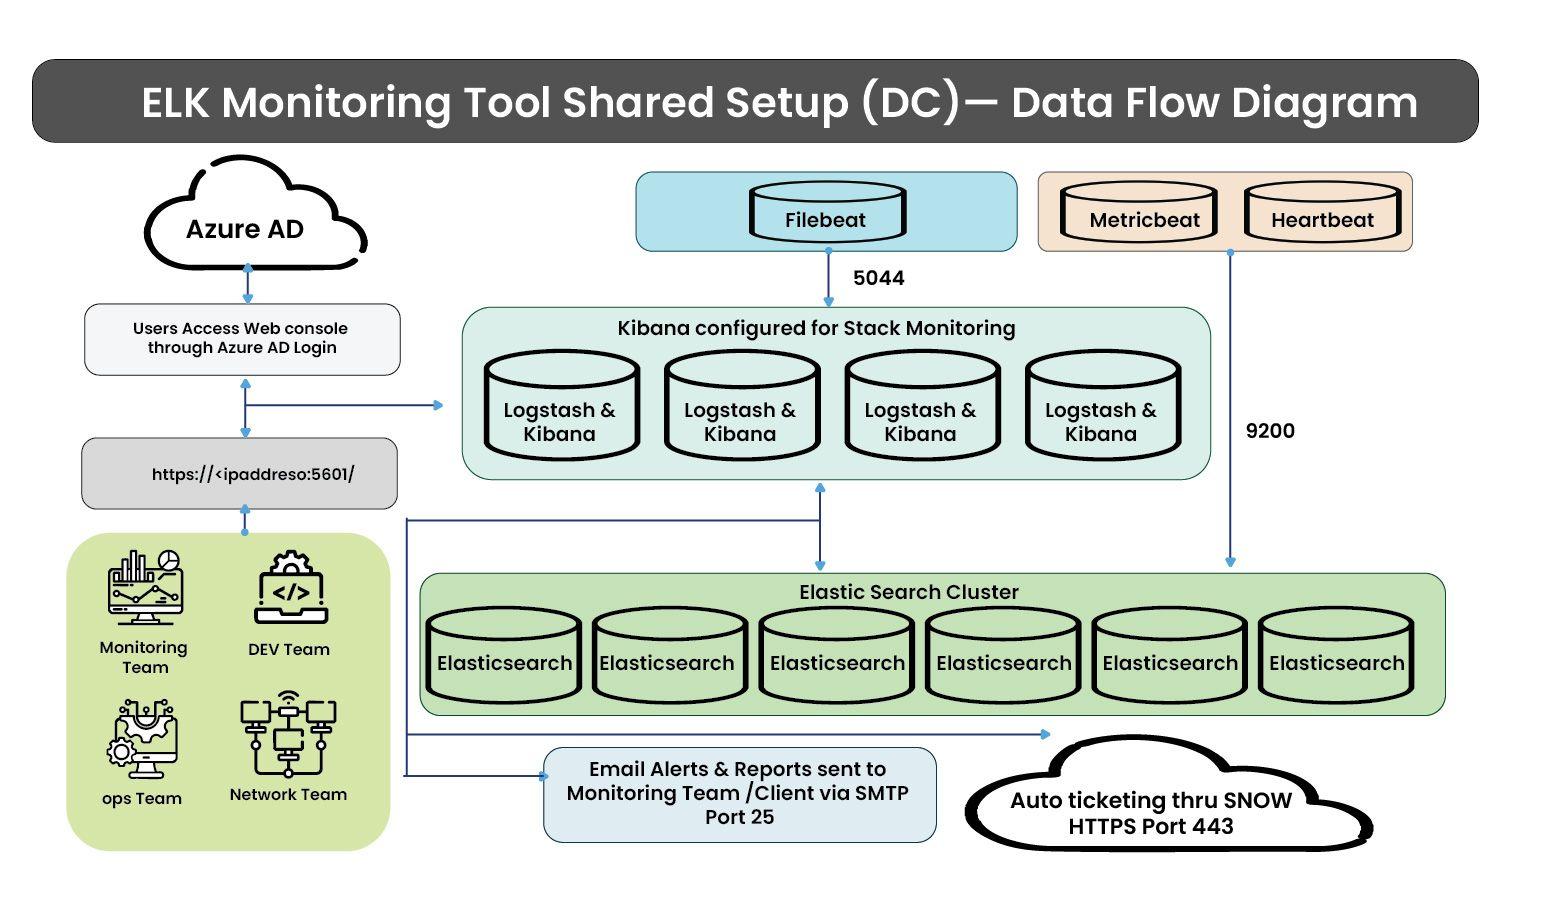
Elasticsearch was already being used for log search and analysis and was handling ingestion well.
The setup included:
- 6 Elasticsearch data nodes, running on-premises
- 4 Kibana nodes used by the monitoring team
- 7-day retention for raw production logs
This setup was good for search and dashboards. But alerting logic became complex as requirements increased.
That is where Python came in.
Why Python was added
Elastic’s native alerting works well for simple cases. In this environment, the logic was more complex.
I needed to:
- Check every log, not sampled data
- Run checks at short intervals
- Compare current data with previous days
- Apply multiple levels of aggregation
- Avoid creating multiple incidents for the same issue
Handling all this directly inside Elasticsearch was difficult. Using Python made the logic easier to manage and extend.
What the Python automation does
The Python layer works alongside Elasticsearch.
It does the following:
- Runs checks at 1, 5, and 10 minute intervals
- Fetches data from Elasticsearch and applies multi-step aggregation
- Creates aggregated indexes at:
- 5-minute
- 1-hour
- 1-day levels
- Stores aggregated data for longer-term analysis
- Triggers alerts and generates reports
This helped separate data processing from decision logic.
Types of alerts that were implemented
Alerts were designed based on real production issues.
They include:
- Threshold-based alerts for spikes
- No-data alerts when logs stop coming
- Ratio-based alerts for complete or abnormal declines
- Comparison-based alerts:
- Today versus yesterday
- Today versus 2 days earlier
Overall, the system runs 200+ alert rules and triggers around 2,000–3,000 alerts per day.
To reduce noise, repeated alerts for the same issue update the same incident instead of creating new ones.
Reporting and integration with operations
Alerts are integrated with the incident management system so teams can track and act on them.
In addition:
- Some alerts are sent by email
- 20–30 daily reports are generated
- 10+ weekly reports are shared
- 3–5 hourly reports provide frequent updates
Reports are shared as dashboard links, PDF, Excel, or HTML, based on team needs.
Aggregation is also used to control data growth.
Instead of storing every similar log event separately, similar logs are grouped and counted. This reduces index size while still keeping useful trends.
This made it possible to retain meaningful data without storing all raw logs for long periods.
What changed after this setup
After this system was in place, the impact was clear:
- 33% reduction in manual monitoring effort
- 25% reduction in P1 escalations
- Critical alerts delivered within 1 minute
- Faster identification of transaction-related issues
Operations teams no longer needed to constantly watch dashboards. They could focus on fixing real problems.
Final thoughts
This experience shaped how I approach observability work. I start from real operational problems, not tools or dashboards. I design for scale and comparison because most issues do not show up as simple threshold breaches. I use tools where they fit best and measure success by reduced effort and faster response.
At Ashnik, this is how we build observability solutions for enterprises across industries. We focus on how systems behave in production and design setups that help teams detect issues early and act with confidence.


