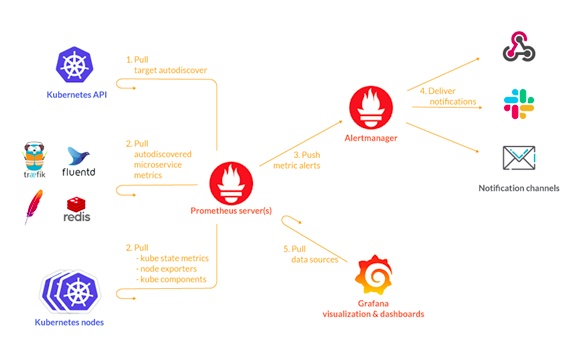

Today, most companies are adopting containerization to speed up development and ease scalability. While containers simplify the development and operations process, they do add significant complexities to your application stack. Security and monitoring for containers is vastly different from traditional methods due to the ephemeral nature of containers. Additionally, containers are mostly used in tandem with an orchestration tool – to automate starting, stopping, creating, and destroying them and removing a lot of manual intervention. This adds an additional level of complexity. Most projects use containers along with Kubernetes/ Swarm for their orchestration.
Traditionally, in host-centric infrastructure, we were used to monitoring only two layers – Applications and the Host servers running them. Now with containers and their orchestration tools in between these layers, we add an additional layer of abstraction and complexity into our systems. This extra layer also requires monitoring, but traditional tools fall behind while attempting this. To note a few challenges, orchestration tools schedule applications dynamically, creating and destroying containers as required. Therefore, a monitoring system with service discovery is essential for flawless monitoring of our systems. The monitoring solution built for such an environment should automatically adapt metric collection to moving containers so that application monitoring goes on smoothly without any hiccups.
Metrics to Monitor
While there are many metrics overall that should be monitored in our Kubernetes cluster, they can be broadly categorized into 2 categories.
1) Node level metrics
These metrics denote the amount of resources available at a node level, such as total memory utilization, buffer memory, disk and network utilization.
2) Kubernetes/Swarm object metrics
These metrics denote the state of objects at the orchestration level. For example, in a system that uses Kubernetes for orchestration, we would have to monitor the number of deployments that are up and running, available and unavailable deployments, running services, resource limits and consumption by Pods and many more.
Initial Monitoring Setup
Currently, there are many tools available to help us monitor the above-mentioned metrics. One of the most popular ways to monitor a Kubernetes system is to use it in combination with Prometheus- An open-source time-series database to collect all metrics, and Grafana, an intuitive analytics and dashboarding application to display the metrics collected. Let us take a look at the steps at setting up both Prometheus and Grafana.
This guide assumes that we have a simple swarm/Kubernetes cluster setup.

Setting up Prometheus
There are multiple ways to set up Prometheus in your environment. For starters, we need to set up a Prometheus server. This can be done inside the Orchestration setup or as an external server too. We recommend setting up a separate monitoring server so that the monitoring system is separated from the system it is trying to monitor. Prometheus can be installed using tar files provided on their website or by cloning its GitHub repository.
Once Prometheus server is installed, we need to set up
- Node-exporter, to gather node level metrics
With Kubernetes or swarm running in mixed mode, it is prudent to set up Prometheus node exporter as a daemonset and then expose it via a service. Running it as a daemonset removes the effort of installing node exporter manually on every node in the cluster
If this is not possible, Prometheus provides node exporter tar files that can be manually run on every node in the cluster
- kube-state-metrics- To gather Kubernetes object level metrics
kube-state-metrics is a simple service that listens to the Kubernetes API server and generates metrics about the state of the objects. It uses metrics from the Kubernetes API without modification. The GitHub page for kube-state-metrics has detailed information available for installation and configuration.
After configuring both exporters, we need to configure Prometheus external server such that it can listen to these services. This will help us have all metrics available on our Prometheus UI.
Setting up Grafana
For setting up Grafana to display metrics collected by prometheus in a much more understandable manner, first we need to install Grafana using the official source images provided under their website.
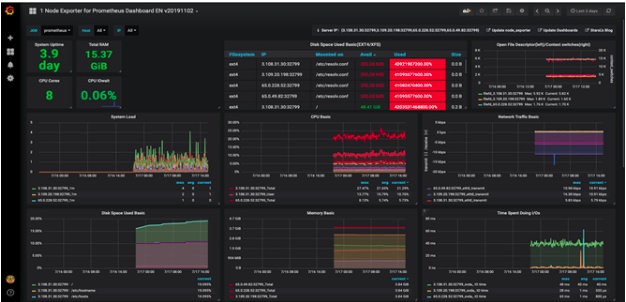
Once this is done, we have two options- creating a dashboard from scratch or importing premade dashboard templates. Grafana has many freely available dashboards that display container metrics effectively. Using these dashboards is as simple as importing the dashboard key/json file into our Grafana setup and setting up metadata for the same. A sample freely available Grafana dashboard will look like this:

Conclusion
In Today’s heavily containerized world, monitoring needs to adapt to meet new needs and challenges. Traditional tools are no longer sufficient for monitoring and open-source tools such as Prometheus and Grafana are a viable option to make sure your applications run smoothly. It is important to note that this setup only works to ingest metrics and not logs. Every good monitoring solution also comes with a way to store and view logs conveniently. Elasticsearch is a powerful tool for pulling logs from containerized workspaces, you can read more about it in our blogs.
To know more about how we can fine-tune monitoring and ensure we collect and display every relevant metric for application stability, reach out to us at success@ashnik.com.


