
Table of Contents
Why are error budgets critical to reliability operations?
Because they give you a quantifiable margin for failure—something most teams overlook until it’s too late. We’ve seen SLO-based strategies prevent major incidents in real-world Elastic implementations, especially where transaction latency or API uptime governs SLA contracts. In this blog, I’ll show you how we’ve built and operated real-time SLO monitoring with Elastic across production environments—reliably, scalably, and with clarity.
I’m not here to tell you what an SLO is. If you’re reading this, you already know the theory. I’m here to show you how we operationalize error budgets using Elastic—at scale, under pressure, and with measurable results.
Why Most Elastic SLO Dashboards Miss the Mark
Here’s the dirty secret: most Elastic SLO implementations fail because they stop at dashboards. And when they do, SRE teams lose the ability to correlate burn rates with real incident data—making root cause analysis slower and SLA breaches harder to predict or contain.
They show you:
- “Error budget remaining: 99.9%”
- “SLO target: 99.95%”
- “Burn rate: 0.3x”
Useful? Barely. What you need is real-time, root-cause actionable telemetry.
The Ashnik Way: Real-Time SLO Monitoring with Elastic
Here’s how we build real-time SLO monitoring using Elastic across high-volume platforms (think: 3B+ log events/day):
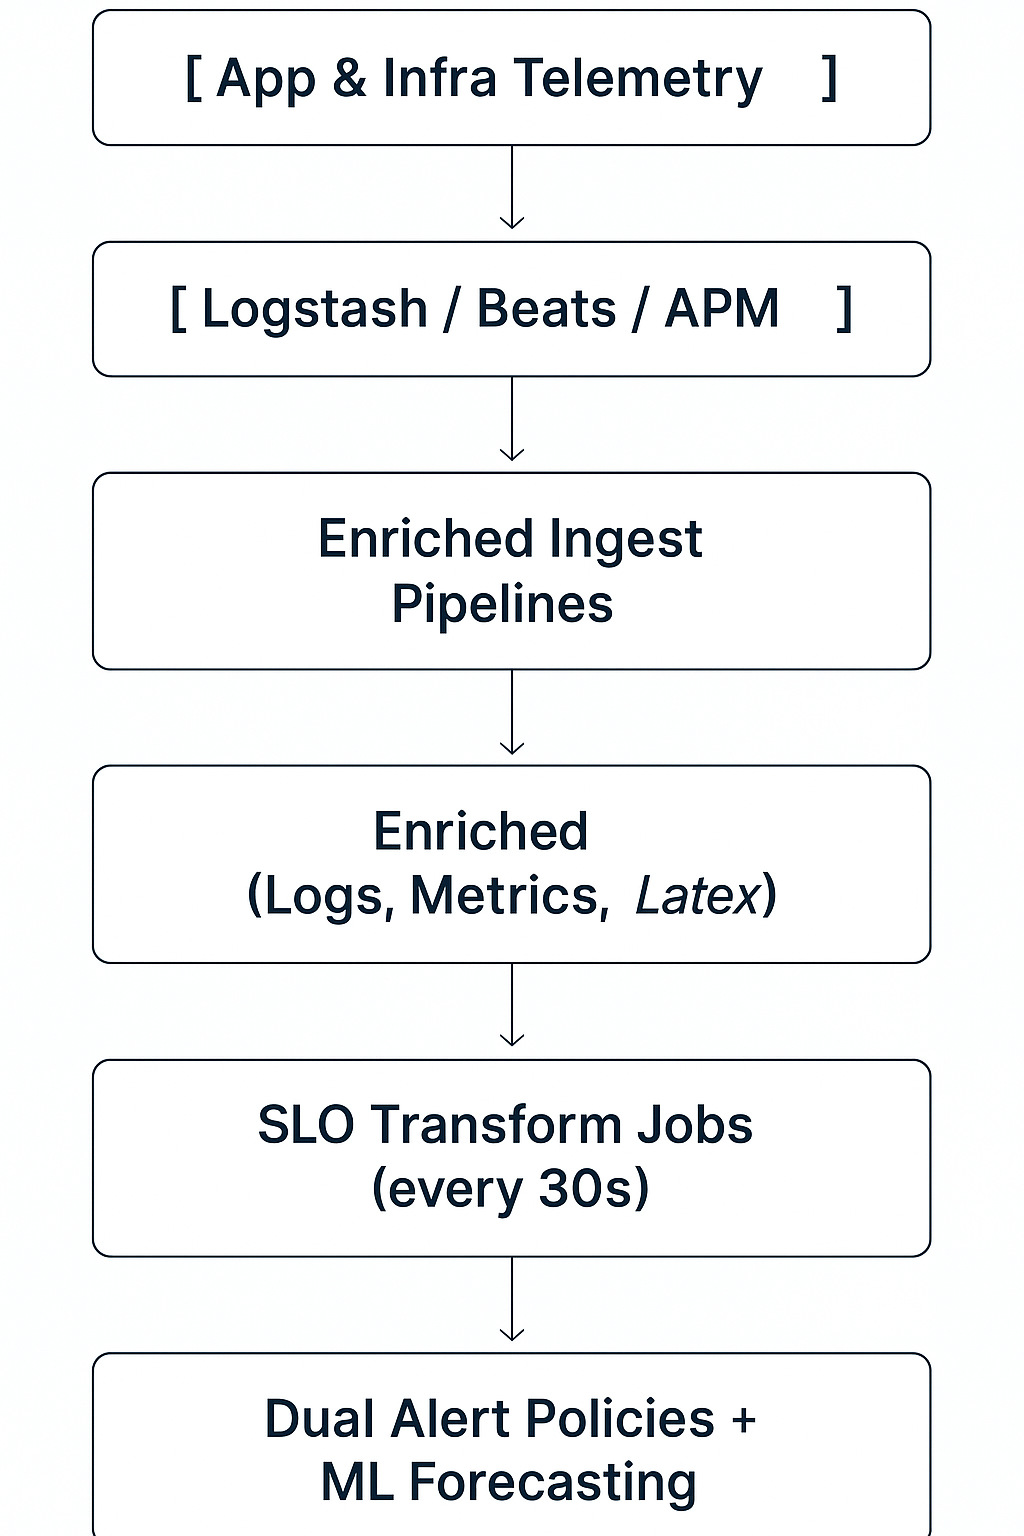
Architecture Blueprint
[ App & Infra Telemetry ]

↓

[ Logstash / Beats / APM ]

↓

[ Enriched Ingest Pipelines ]

↓

[ SLI Indices (Logs, Metrics, Latency) ]

↓

[ SLO Transform Jobs (every 30s) ]

↓

[ Burn Rate Dashboards in Kibana ]

↓

[ Dual Alert Policies + ML Forecasting ]
Every 30 seconds, we re-evaluate SLOs and feed burn rate trends into Elastic ML jobs for forecasted budget depletion.
Deep Dive: Alerting on Burn Rate—Our Battle-Tested Strategy
Elastic lets you define burn rate alerts, but defaults are too simplistic. We deploy dual-window burn tracking using custom rules:
Why Two Windows?
- 1h Burn Rate > 2.0x → something’s spiking hard
- 6h Burn Rate > 1.0x → something’s quietly eroding
We use both to avoid false alarms and catch slow burns.
Alert Payload Template
{

"service": "payment-api",

"burn_rate_1h": 2.3,

"burn_rate_6h": 1.1,

"error_budget_remaining": "67%",

"top_offenders": [

"POST /api/transfer",

"POST /api/retry"

],

"correlation_id": "eeb2d21a-xyz"

}
Pushed to Slack + Opsgenie. Includes link to pre-filtered Kibana view.
Visual Insight: Kibana Burn Rate Dashboard Essentials
We standardize 3 visual patterns per SLO:
- Gauge: Remaining budget
- Time Series (1h, 6h, 24h): Burn rate over time
- Top Contributors Table: Most frequent failing queries or services
We enrich APM traces with service tags, user IDs, and region metadata.
Real Case: Error Budget Monitoring in a Core Banking Platform
Client: Financial products company managing infrastructure for 50+ banks
Workload: UPI transactions, OTP validations, payment switch observability
Volume: Projected 4x ingestion growth, 10K → 50K indexing/sec after optimization
What Was the Problem?
Their legacy Elastic cluster had:
- An active-passive setup leading to Logstash underutilization
- Indexing/search delays under load
- Limited visibility into error budget consumption across transaction pipelines
When daily volumes spiked, alerting was noisy but incomplete. Errors in the OTP system, which should’ve triggered SLO burn alerts, were hidden in aggregate error logs.
What We Did with Elastic’s SLOs
Ashnik redesigned the Elastic Stack with:
- Unified high-performance cluster (active-active model)
- SLI queries for OTP failures, latency >1s, and payment switch 5xxs
- SLO budgets aligned to internal SLAs:
- 99.95% uptime for OTP
- 99.9% success rate for UPI posting
- Burn-rate alerts on dual windows (1h, 6h)
- A custom SLO dashboard integrated into executive monitoring
Outcome
- 5x improvement in indexing and search rates
- Watchers scaled from 700 → 1,000 with real-time burn-rate detection
- Faster triage: OTP issues surfaced in real time before helpdesk tickets
- Business benefit: Enabled predictive reliability ops without expanding headcount
Advanced Strategies We Recommend
Fallback SLIs
Don’t trust one signal. For each SLO, we define:
- Primary SLI (e.g., APM duration)
- Fallback (e.g., error logs from reverse proxy)
- “Confidence ratio” dashboard
Transform Optimization
- Batch interval: 30s
- Lookback range: 10m
- Retain 30d of rollup
- Use Index Lifecycle Management (ILM) to offload to warm/cold after 7d
ML Forecasting
Feed burn rate time series to Elastic ML anomaly detection. We tune:
- Model type: high_mean
- Bucket span: 15m
- Look-ahead window: 3h
This gives us forecasted budget depletion great for proactive ops.
Final Word
Most teams think they’re monitoring reliability. What they’re really doing is reacting to outages.
Real-time SLO monitoring with Elastic flips that. You track the risk, not just the result. You manage reliability like a budget—not a surprise.
If you want to stop missing what matters, this is the moment to start.
Want to make your SLOs real-time, intelligent, and resilient?
Talk to Ashnik. We architect Elastic-powered reliability systems—built for uptime, clarity, and control.


